South-east Asia Armed Conflict Analysis is a data visualisation created to reveal the spatio-temporal patterns of armed conflict in selected South-east Asia countries between 2015-2020.
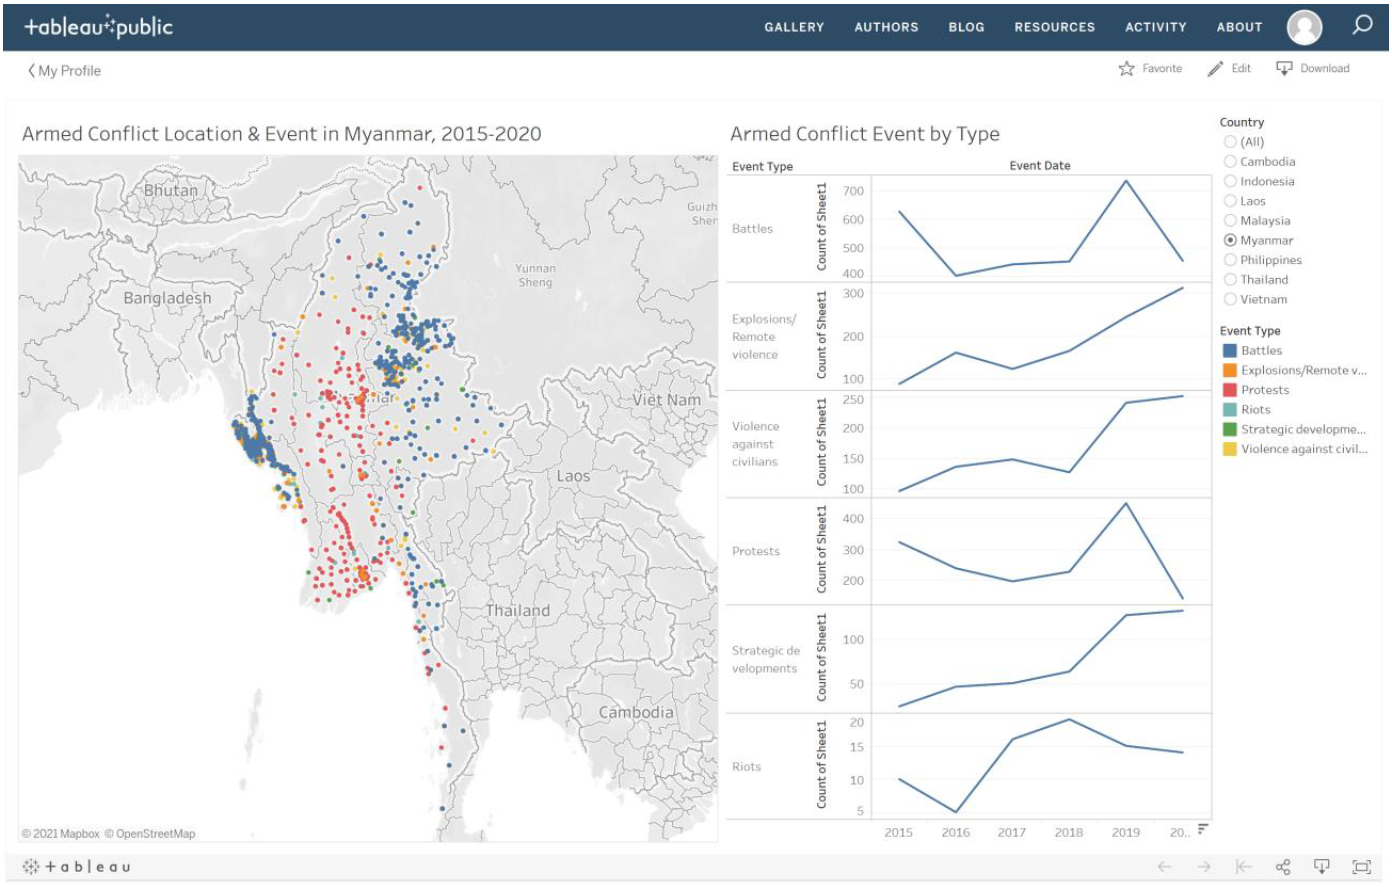
Figure 1: South-east Asia Armed Conflict Analysis
Graph Critiques
| Clarity | Critique |
|---|---|
| 1. | The line graph axis title states “Count of Sheet1”. This does not tell us if this is the count of event occurrences or something else. It is not clear what it is trying to indicate. |
| 2. | Armed Conflict Event by Type does not indicate if it is only for Myanmar, or for all countries |
| 3. | When you hover over the map, the tooltip that appears does not give good information about the data point. It does not indicate the town, but only gives us the geolocation. Next, it gives us the event ID, which does not indicate where the ID is from, or where we can reference it to |
| Aesthetics | Critique |
|---|---|
| 1. | The colours of the dots in the map do not show some transparency, therefore they overlap each other, blocking some data that are behind |
| 2. | The colours chosen - green and red, are not colour blind friendly. Therefore people who are slightly colour blind may not be able to distinguish between the two data points |
| 3. | The sizes of the dots are too small to be able to see clearly on the map. The colour yellow also tends to fade into the background. |
| Interactivity | Critique |
|---|---|
| 1. | The map shows a good scatter of the different event types. However, it does not tell us if the event has happened once, or a few times in the area. Therefore we are unable to gauge how intense the armed conflict location is. |
| 2. | The map shows a scatter of the event types from 2015 to 2020. However, it does not give us an option to toggle the different year events, which may give us a better visualisation of the growing conflict in certain areas. |
What Can Be Improved?
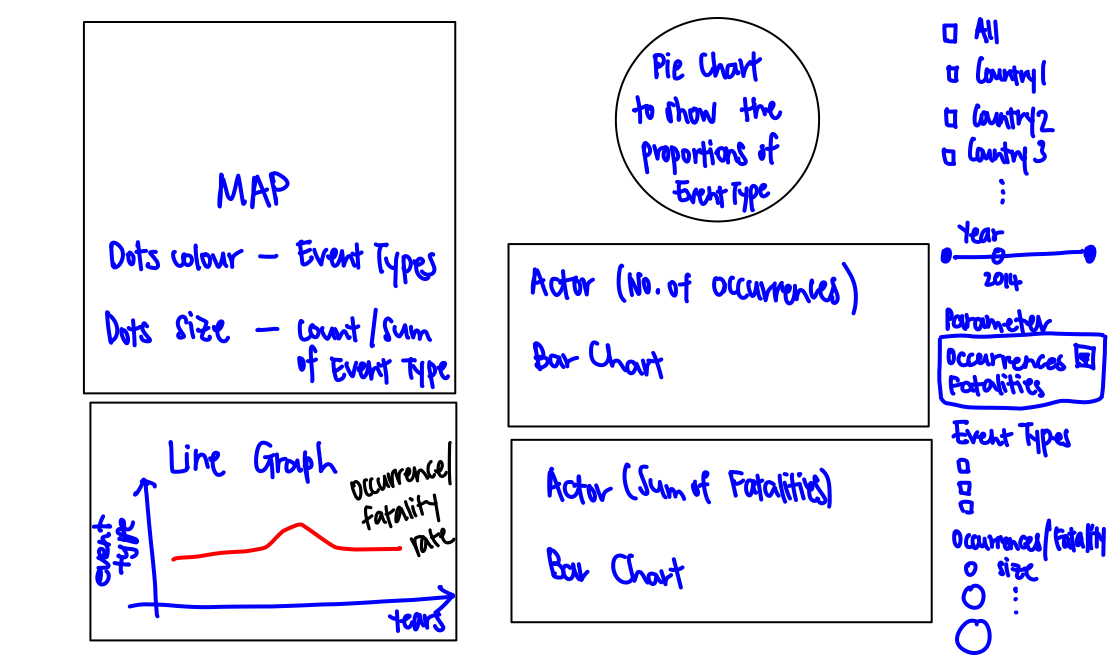
Figure 2: Sketch of Tableau Design
| No. | Improvements |
|---|---|
| 1. | A Multiple Value List for countries has been added, so that users are able to toggle between viewing 1 country, multiple countries or all. This helps them have a greater view of the region in one glance |
| 2. | A slider for Year has been added, so that people are able to visualise the changes in conflict in the region over the years |
| 3. | A Occurrences/Fatalities parameter is also included, so that the user may choose to view on the map the number of occurrences of conflict, or the number of fatalities due to conflict |
| 4. | Colour blind friendly colour palette are chosen for the Event Type, so that people are able to clearly visualise better on the map. Some transparency to the colours are included, so that we are able to visualise the data points on the map despite overlap. |
| 5. | I have included a Count of Occurrences, or Sum of Fatalities, to the size of the dots represented on the map. This will help us visualise where are the areas of higher conflict intensity, and fatality rates |
| 6. | A line graph of Occurrences and Fatalities are added to see changes in armed conflict over the years of different event types |
| 7. | A Pie chart is added to be able to visualise the proportion of event types or fatalities occurring in a country |
| 8. | Bar charts are added to indicate the parties involved in the number of occurrences count, and also fatality count. This help us pinpoint who is accountable |
Proposed Tableau Visualisation
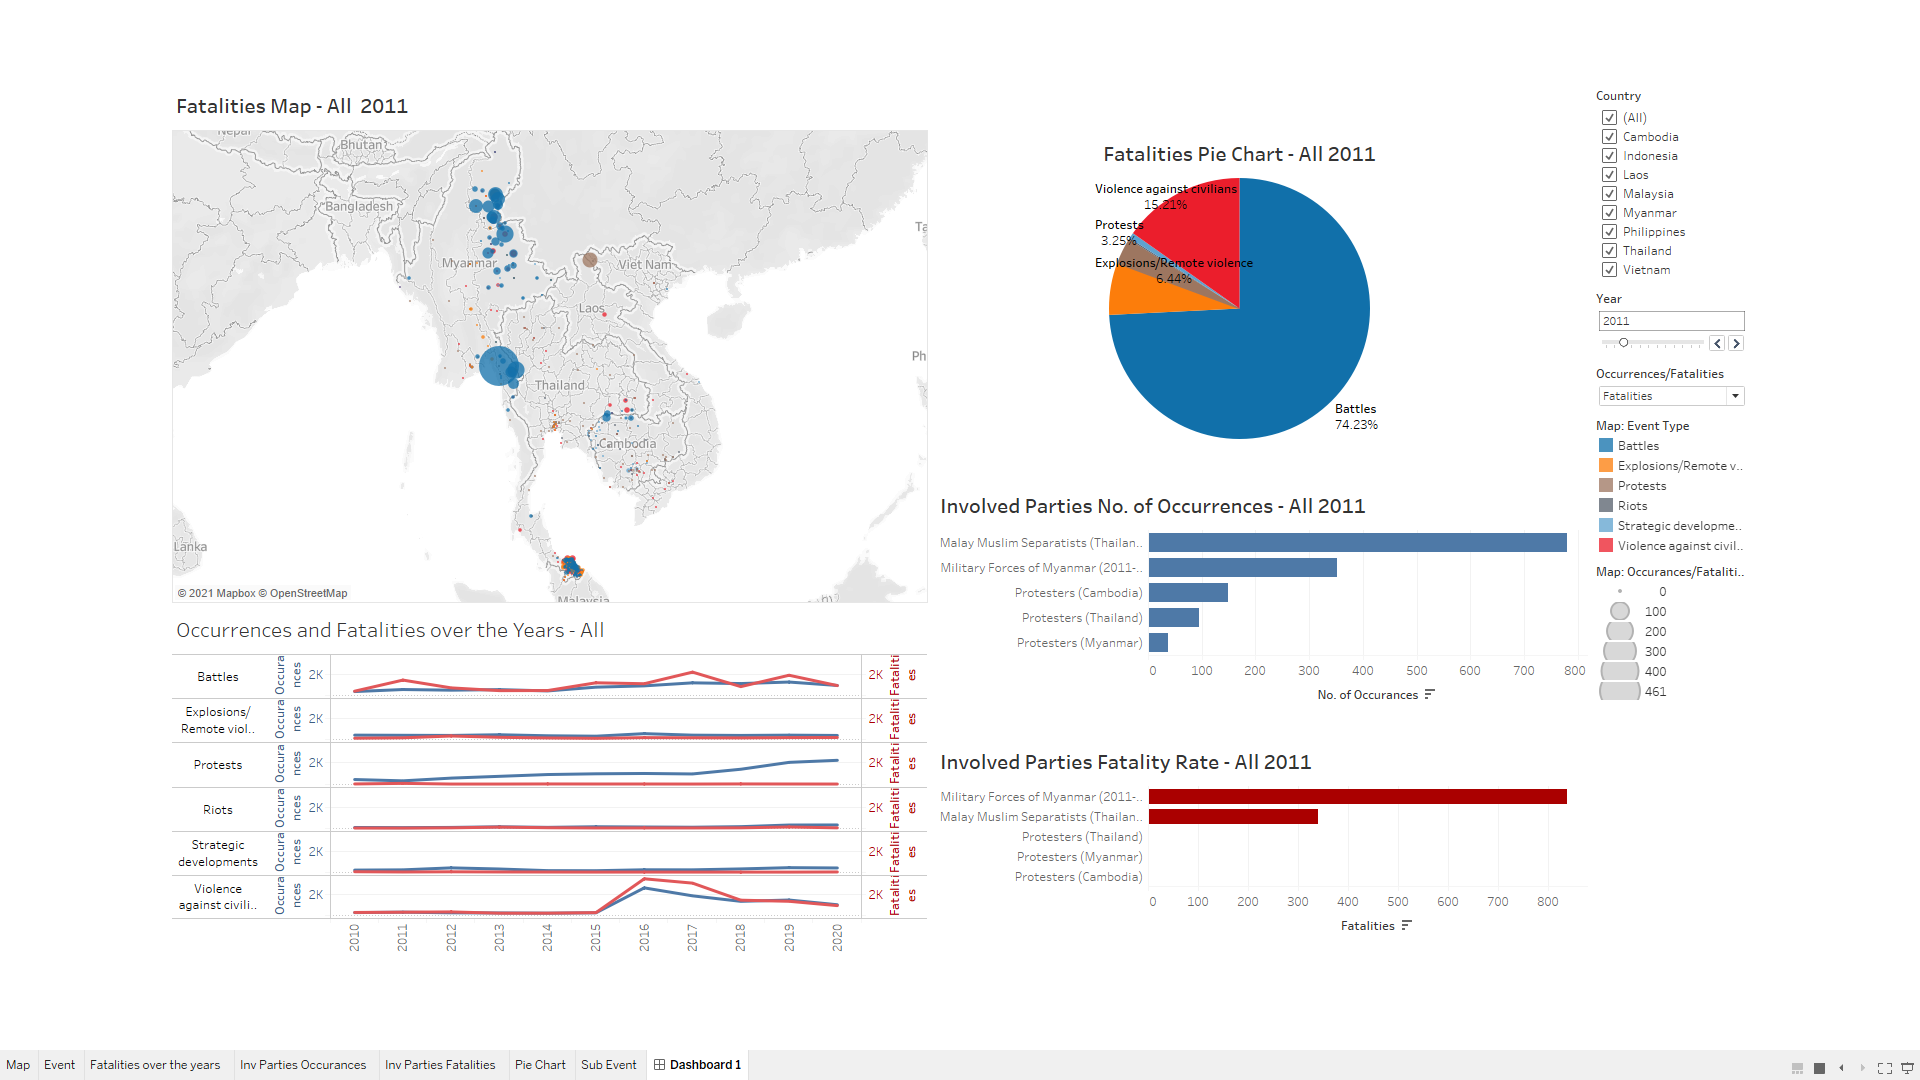
Figure 3: Proposed Tableau Design
An interactive experience can be found at this link: https://public.tableau.com/profile/louelle.teo#!/vizhome/DatavizMakeover3/Dashboard1?publish=yes
Step by Step Guide to Prepare the Tableau Visualisation
Preparing the Dataset

Figure 4: Excel Dataset
Download the data from The Armed Conflict Location & Event Data Project (ACLED), focusing on South East Asia data set.
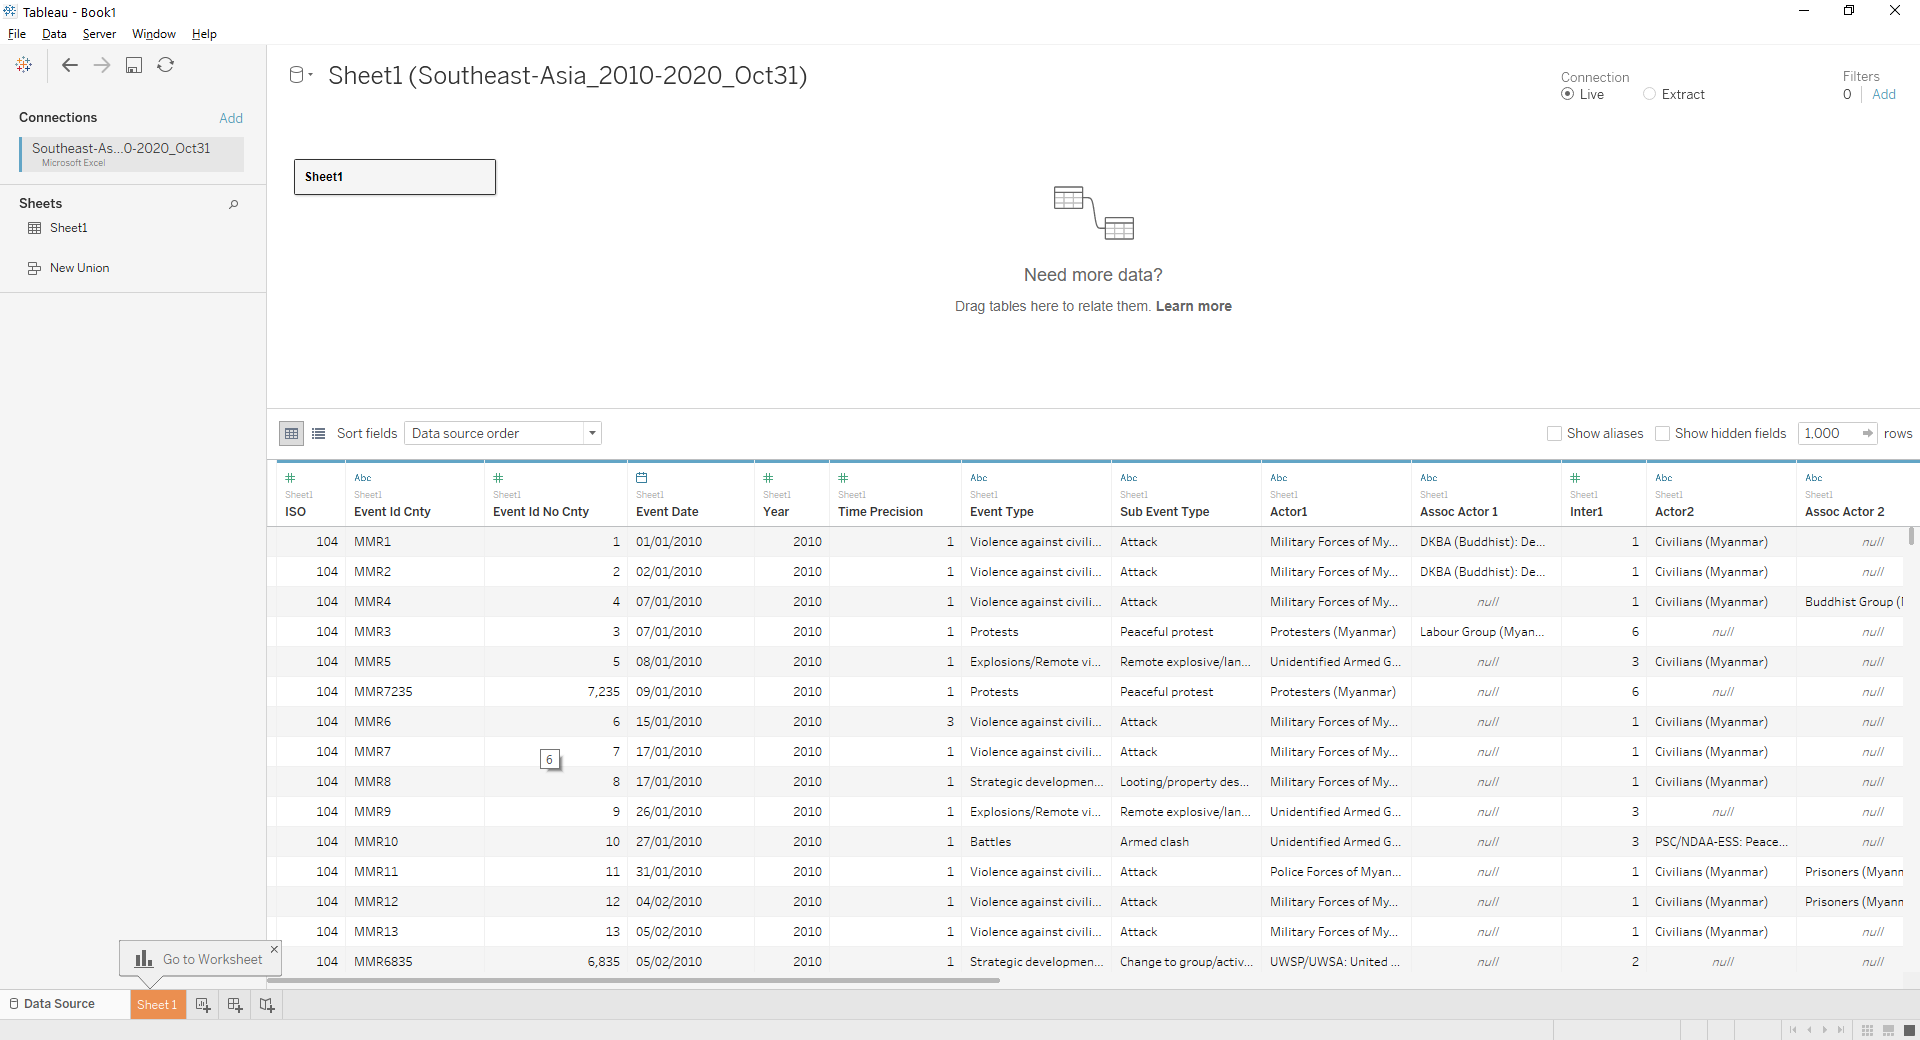
Figure 5: Add to Tableau
Open the data set using Tableau 2020.4. Tablleau will give a summary of all columns of data available and identify each type of data set and it’s properties.
Map Dashboard
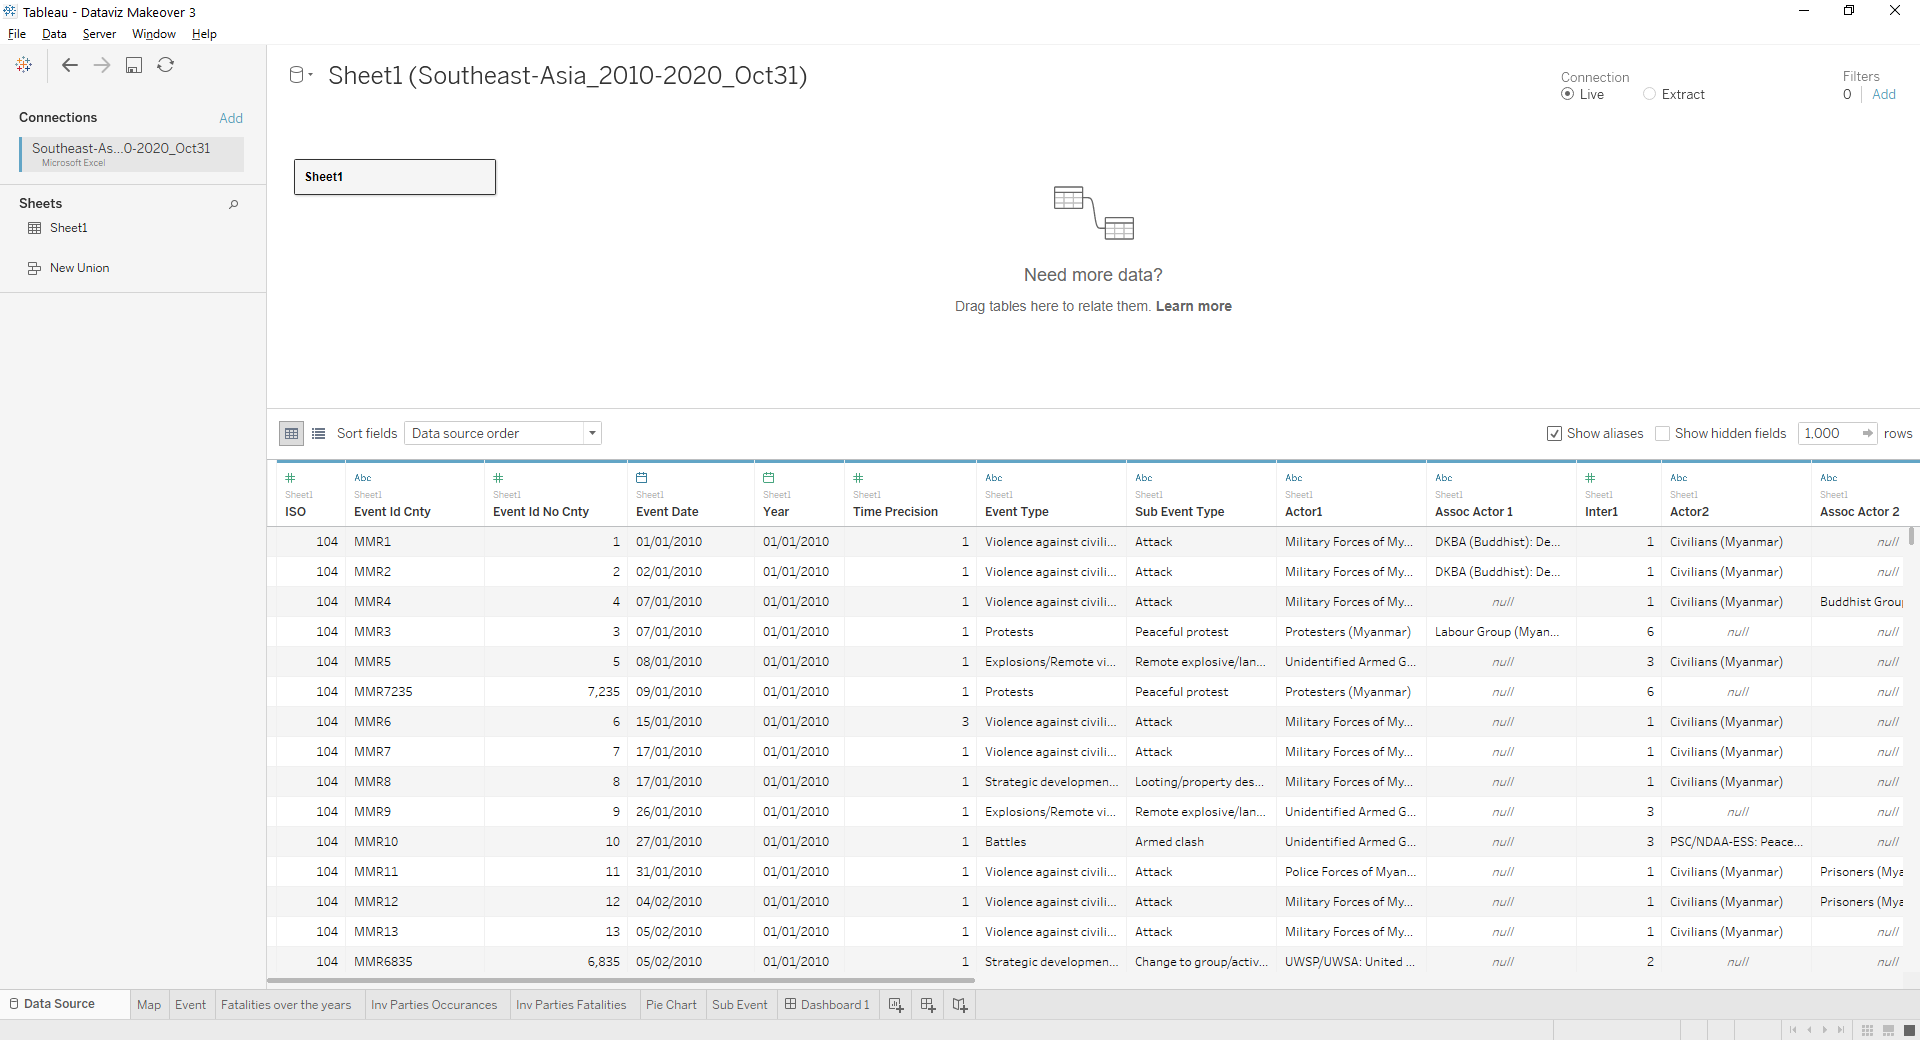
Figure 6: Update the column Properties
Update the correct properties for each column. 1. Year properties should be updated to date format. 2. Ensure Longitude and Latitude have geolocation properties. 3. Categorical data have string properties 4. Numerical data have number properties.
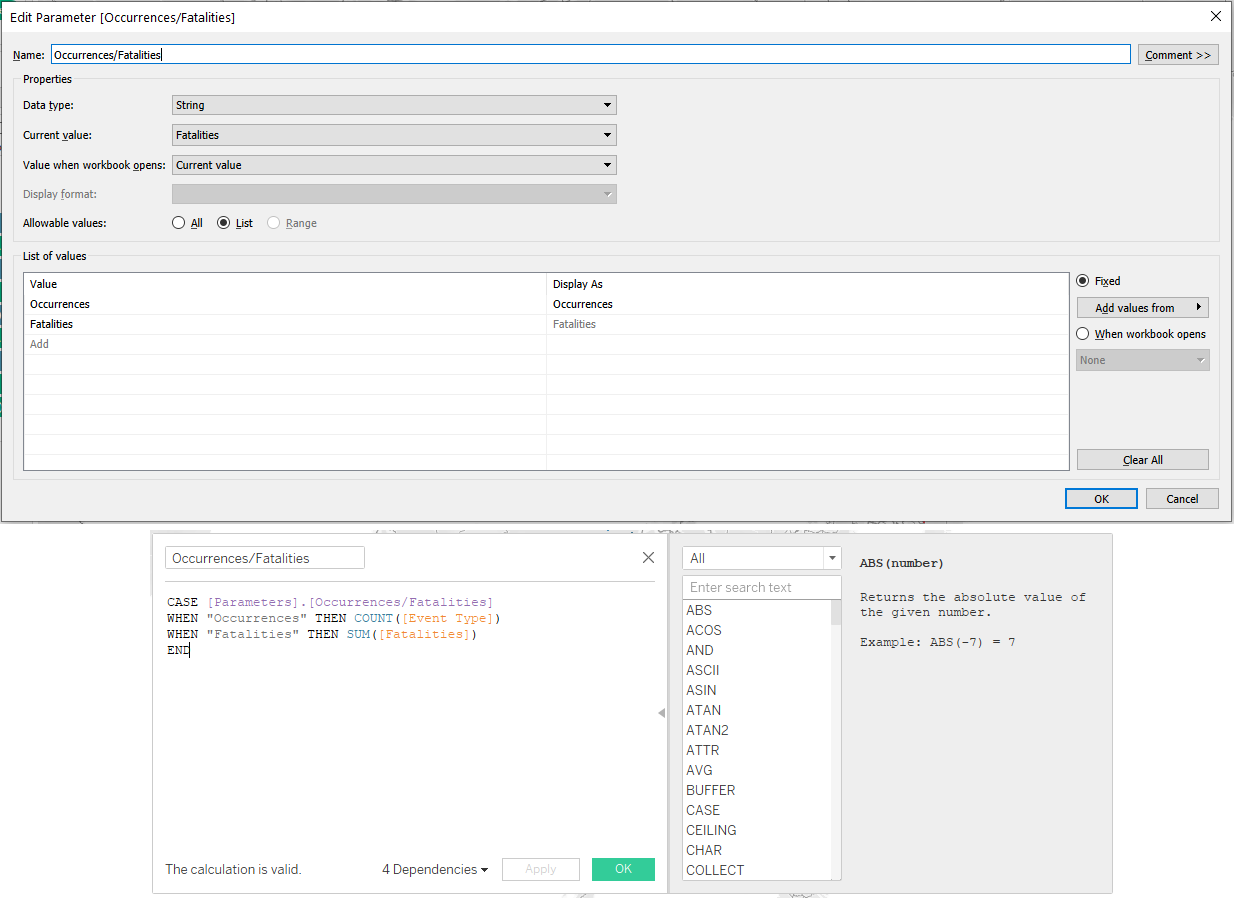
Figure 7: Create Parameter
Create a Parameter Occurrences/Fatalities to create a dropdown choice for users to toggle. Create a measured value with the following code, so that tableau is able to pick up the correct formulas when users toggle.
- Occurrences will have the formula Count([Event Type]). This will give us visibility of the count of events that occurs in a region.
- Fatalities will have the fomula SUM([Fatalities]). This will give us a sum of the number of victims in armed conflicts in a region.
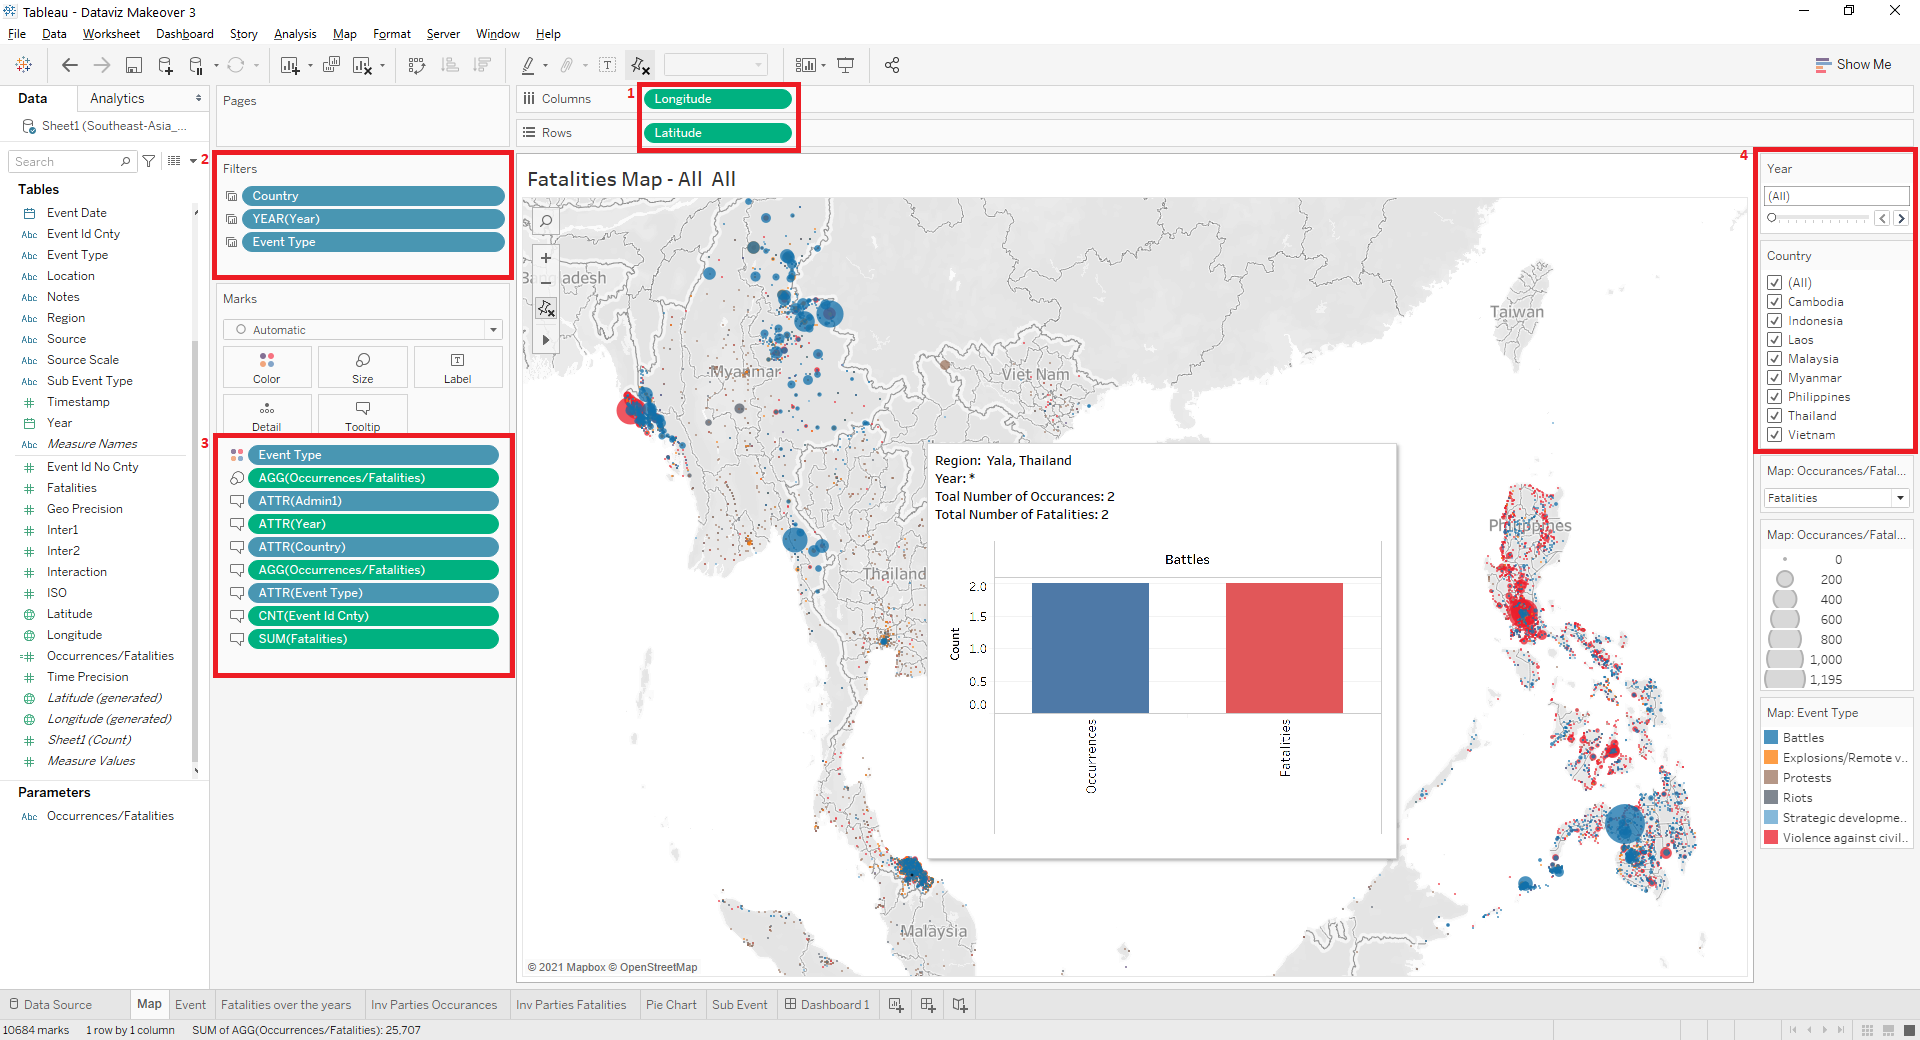
Figure 8: Building the Map
- Add Longitude and Latitude to the Columns and Rows as seen in Figure 1
- Add Country, Year and Event Type to Figure 2
- Add Event Type to Colours, Measured Values Occurrances/Fatalities to Size, Admin 1, Year, Country, Occurrances/Fatalities, Event Type, Event Id Cnty, and Fatalities to Labels as seen in Figure 3.
- Choose to show filter for Year, and Country, and choose the Single Value Slider for Year, and Multiple Values (list) for Country as shown in Figure 4
- Name this Sheet as “Map”
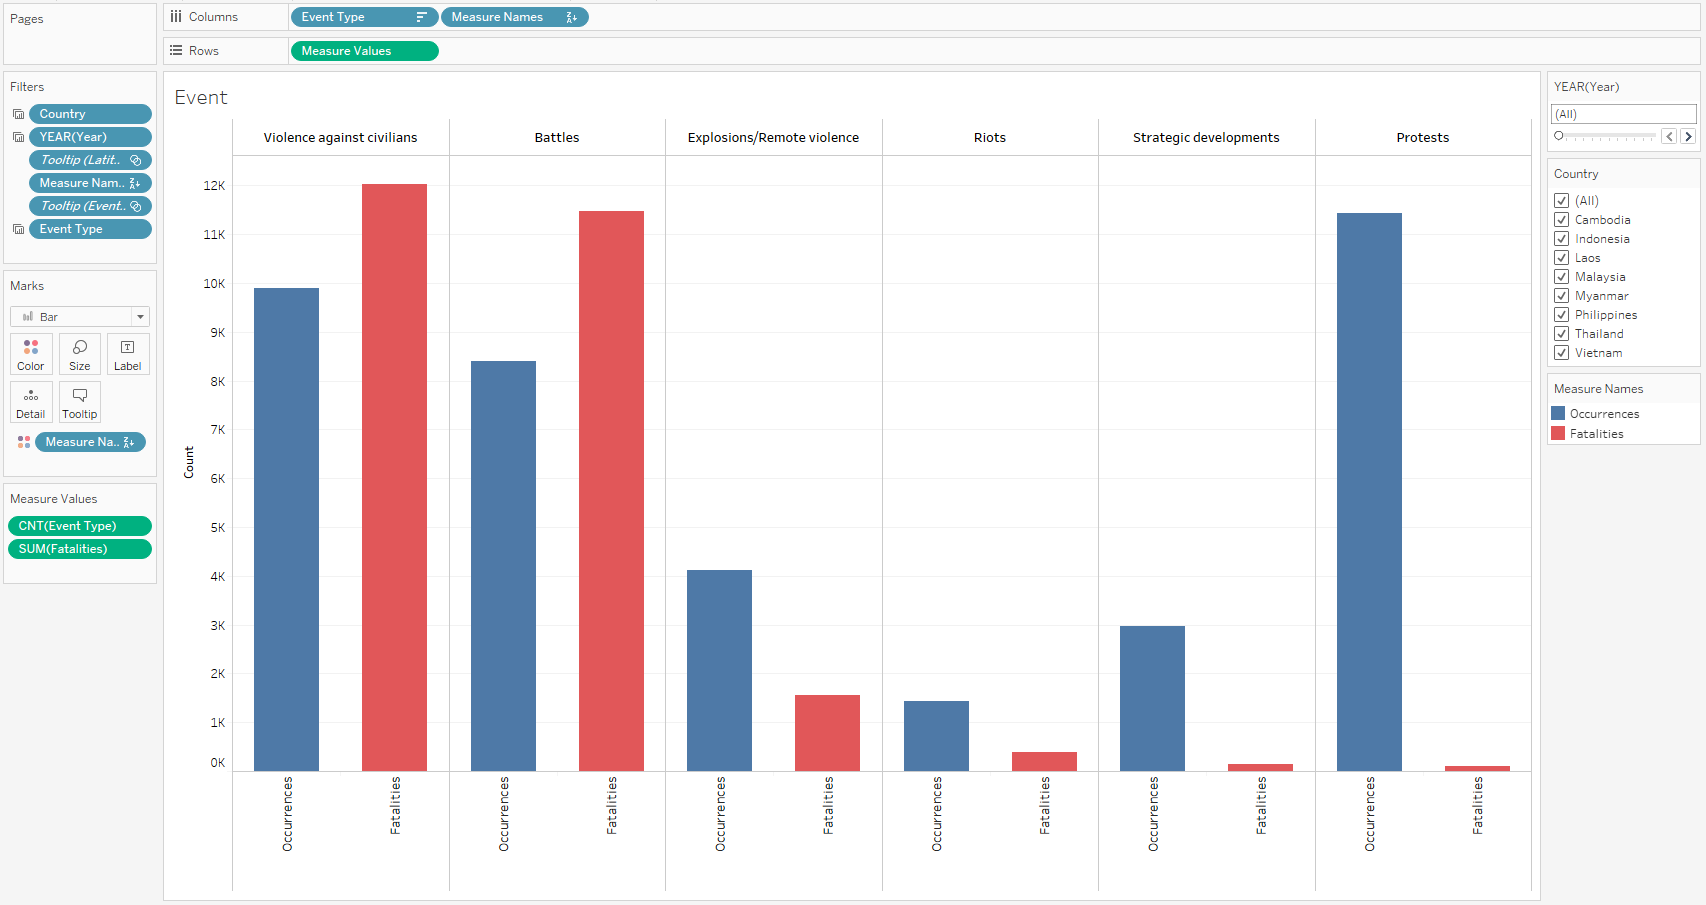
Figure 9: Map Tooltips
Next, we will create this histogram graph for a tooltip in maps. It will indicate the Number of Occurrences and Fatalities of a region, based on Event Type.
- Add Event Type into Columns
- Add Measured Values into Rows
- Choose count(Event Type) and Sum(Fatalities) as the Measured Values
- Add Country, Event Type and Year* to Filter**
- Rename Aliases of Measure Names to Occurrances and Fatalities.
- Name this Sheet “Event”
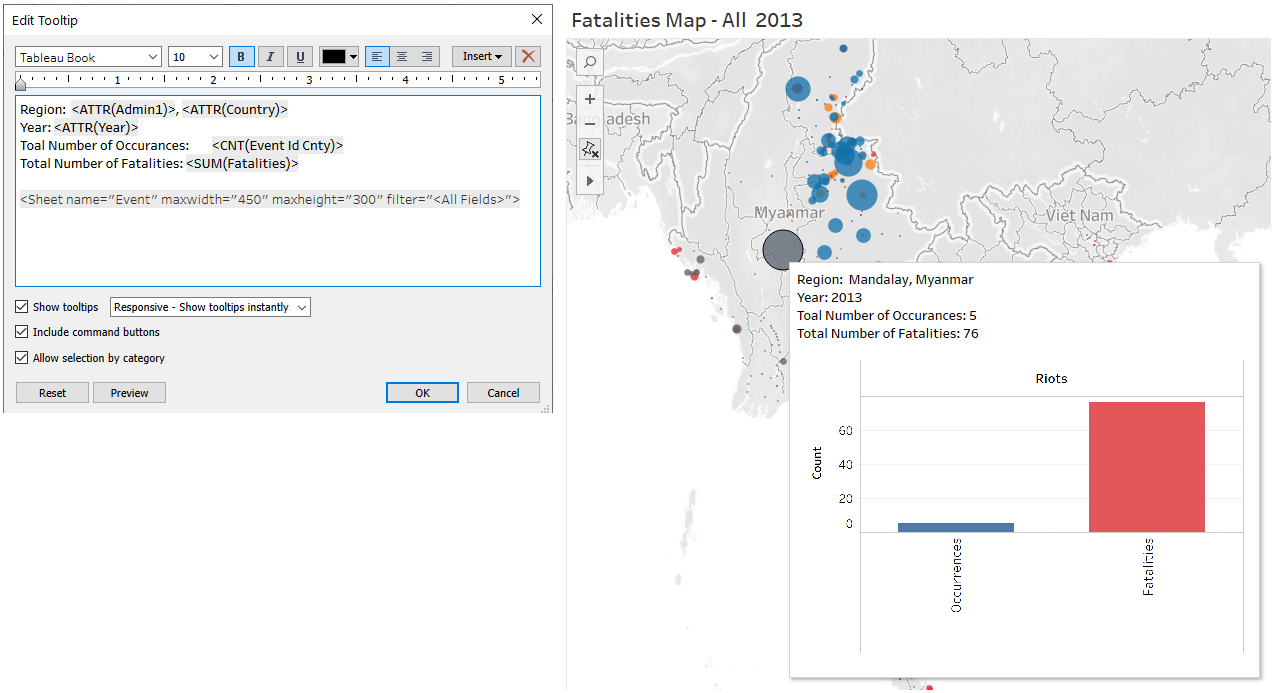
Figure 10: Map Tooltips
Finally, go back to the Map Sheet. Edit the Tooltip with the following code. this is so when the user hovers over a point in the map, the Event Tooltip will appear with the following details.
Line Graph - Occurrances and Fatalities over the Years Dashboard
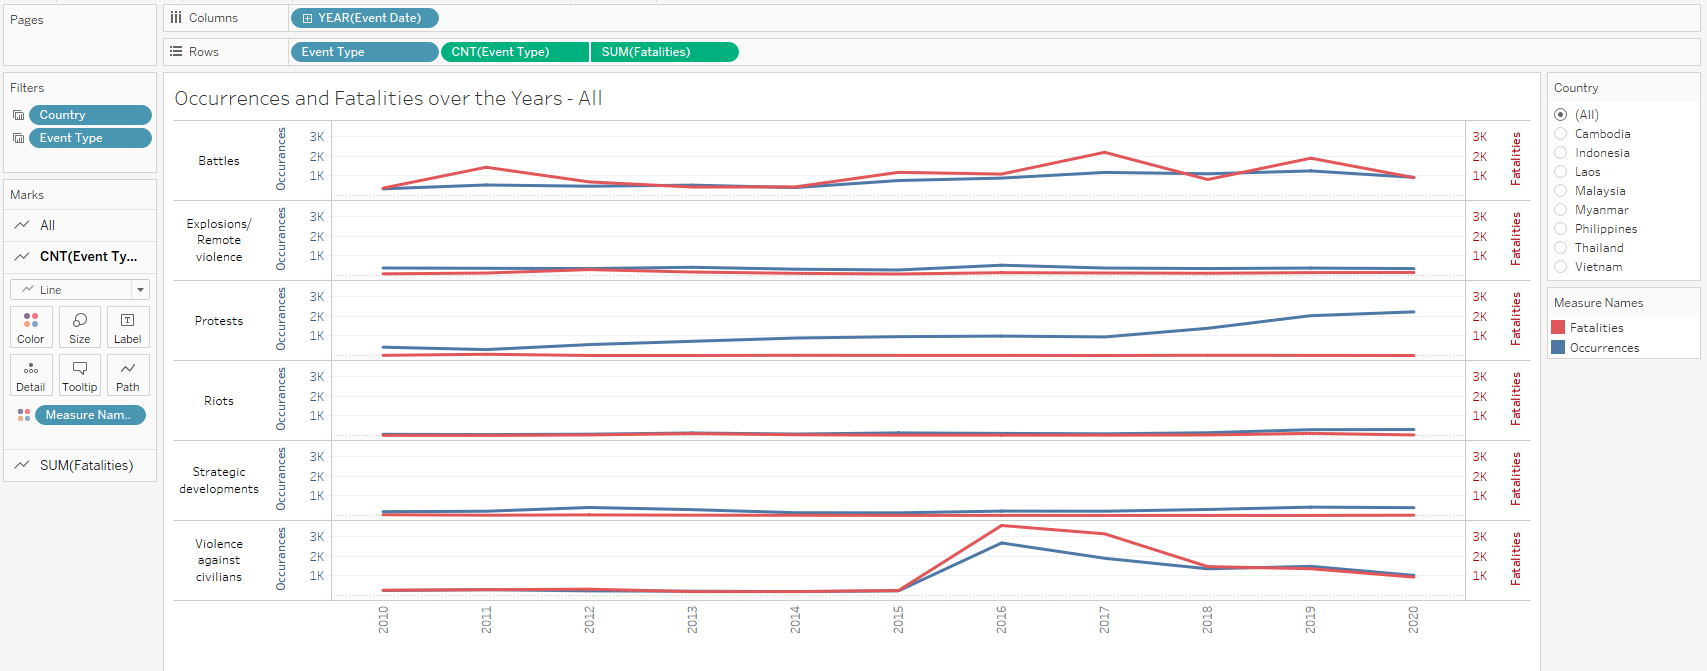
Figure 11: Line Graph
- Add Year to Columns
- Add Event Type to Rows
- Change the Measure of Event Type in Rows to Count
- Add Fatalities to *Rows**
- Change the Measure of Fatalities in Rows to Sum
- Right Click Fatalities and choose Dual Axis
- Right click on the Second Axis on the Chart, and click Synchronize Axis
- Add Event Type Category again to Rows
- Add Country and Event Type to Filter
- Add Measure Names to Colours and update the colours accordingly
- Name the Sheet “Fatalities over the years”
Bar Graph - Involved Parties Dashboard
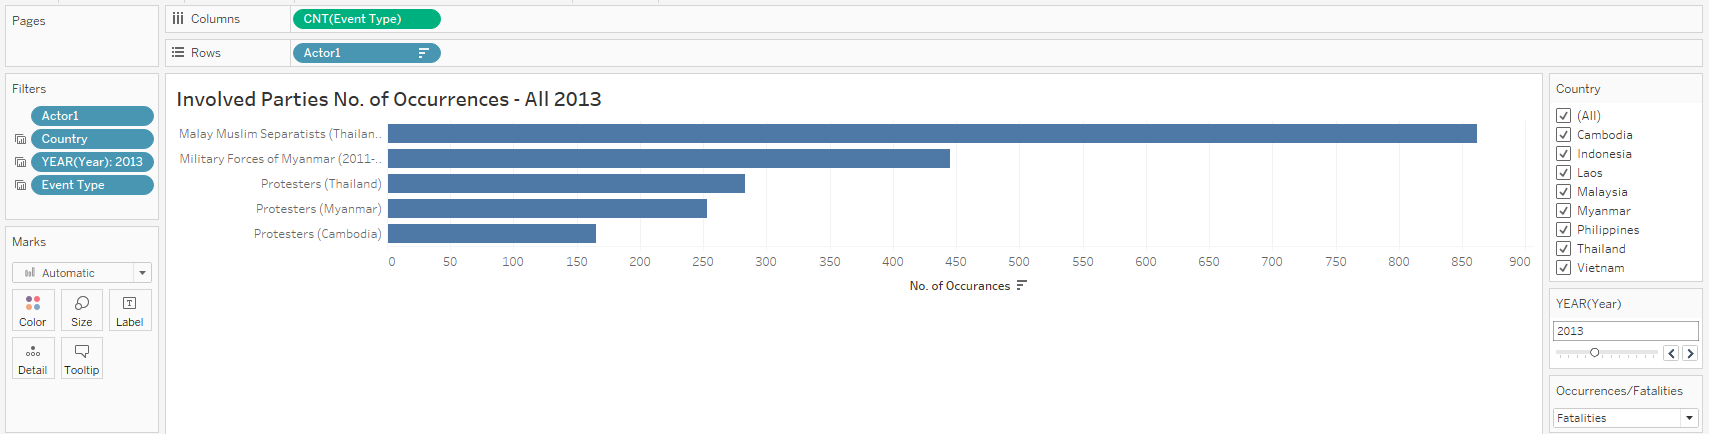
Figure 12: Bar Graph - Number of Occurrences
- Add Event Type to Columns
- Update the Measure of Event Type to Count
- Add Actor 1 to Rows
- Add Actor 1, Country, Year and Event Type to Filters
- Rename Sheet to “Inv Parties Occurrences”
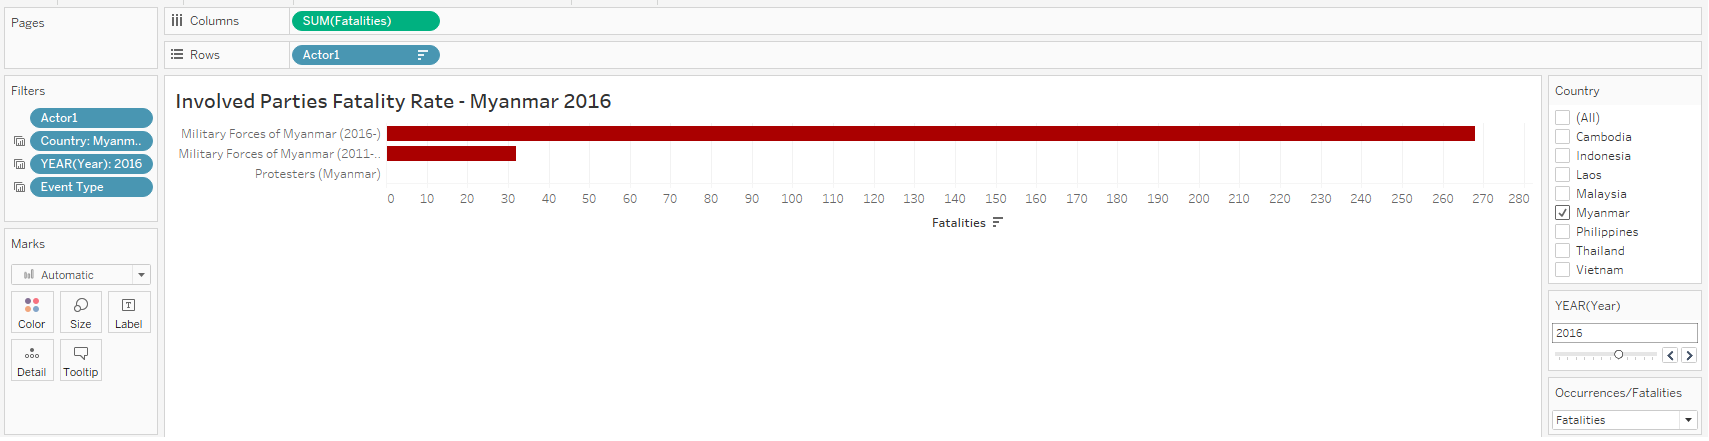
Figure 13: Bar Graph - Fatality Rate
- Add Event Type to Columns
- Update the Measure of Event Type to Sum
- Add Actor 1 to Rows
- Add Actor 1, Country, Year and Event Type to Filters
- Rename Sheet to “Inv Parties Fatalities”
Pie Chart Dashboard
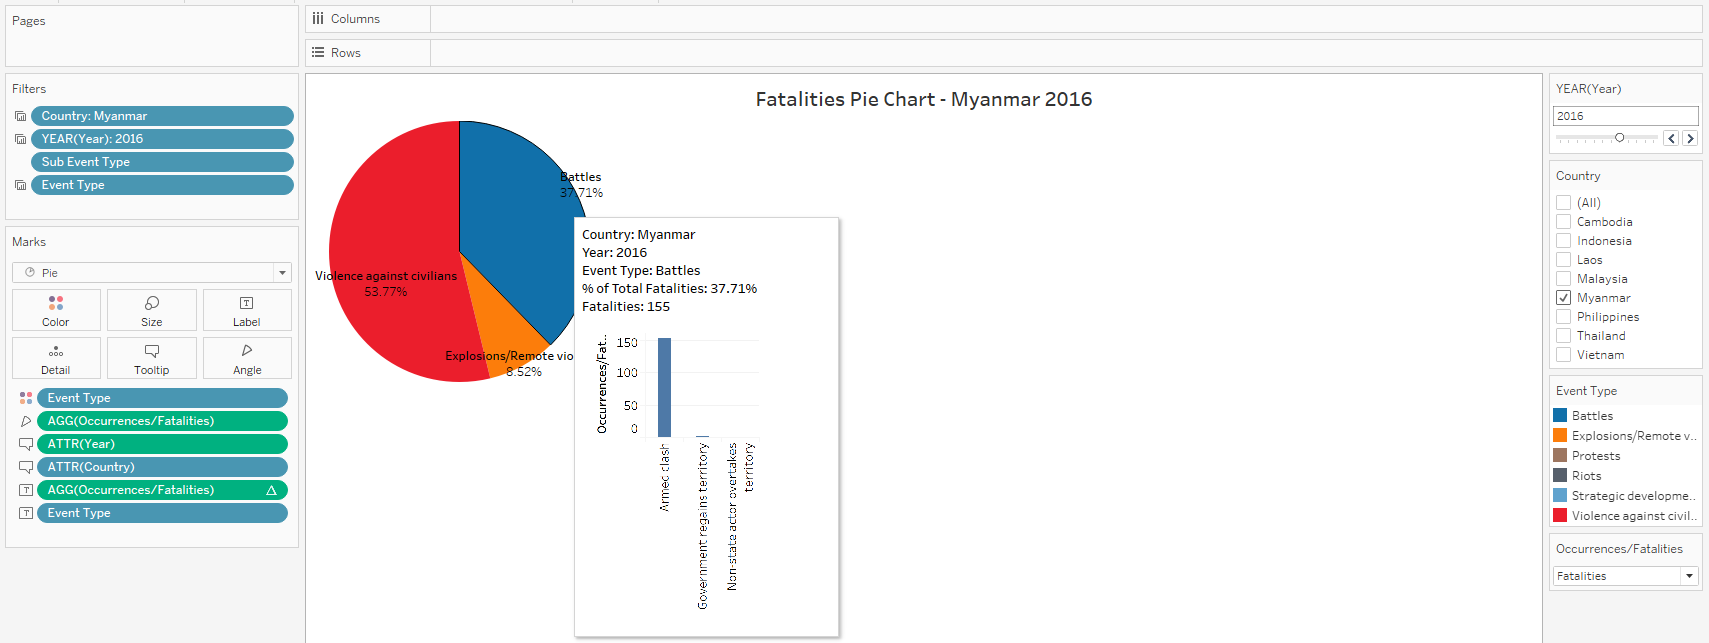
Figure 14: Pie Chart
- Add Country, Year, Event Type to Filters
- Under Marks, Choose Pie
- Add Event Type to Colours
- Add Occurrences/Fatalities to Angle
- Add Year, Country to Tooltip
- Add Occurrences/Fatalities, and Event Type to Label
- Rename Sheet as “Pie Chart”
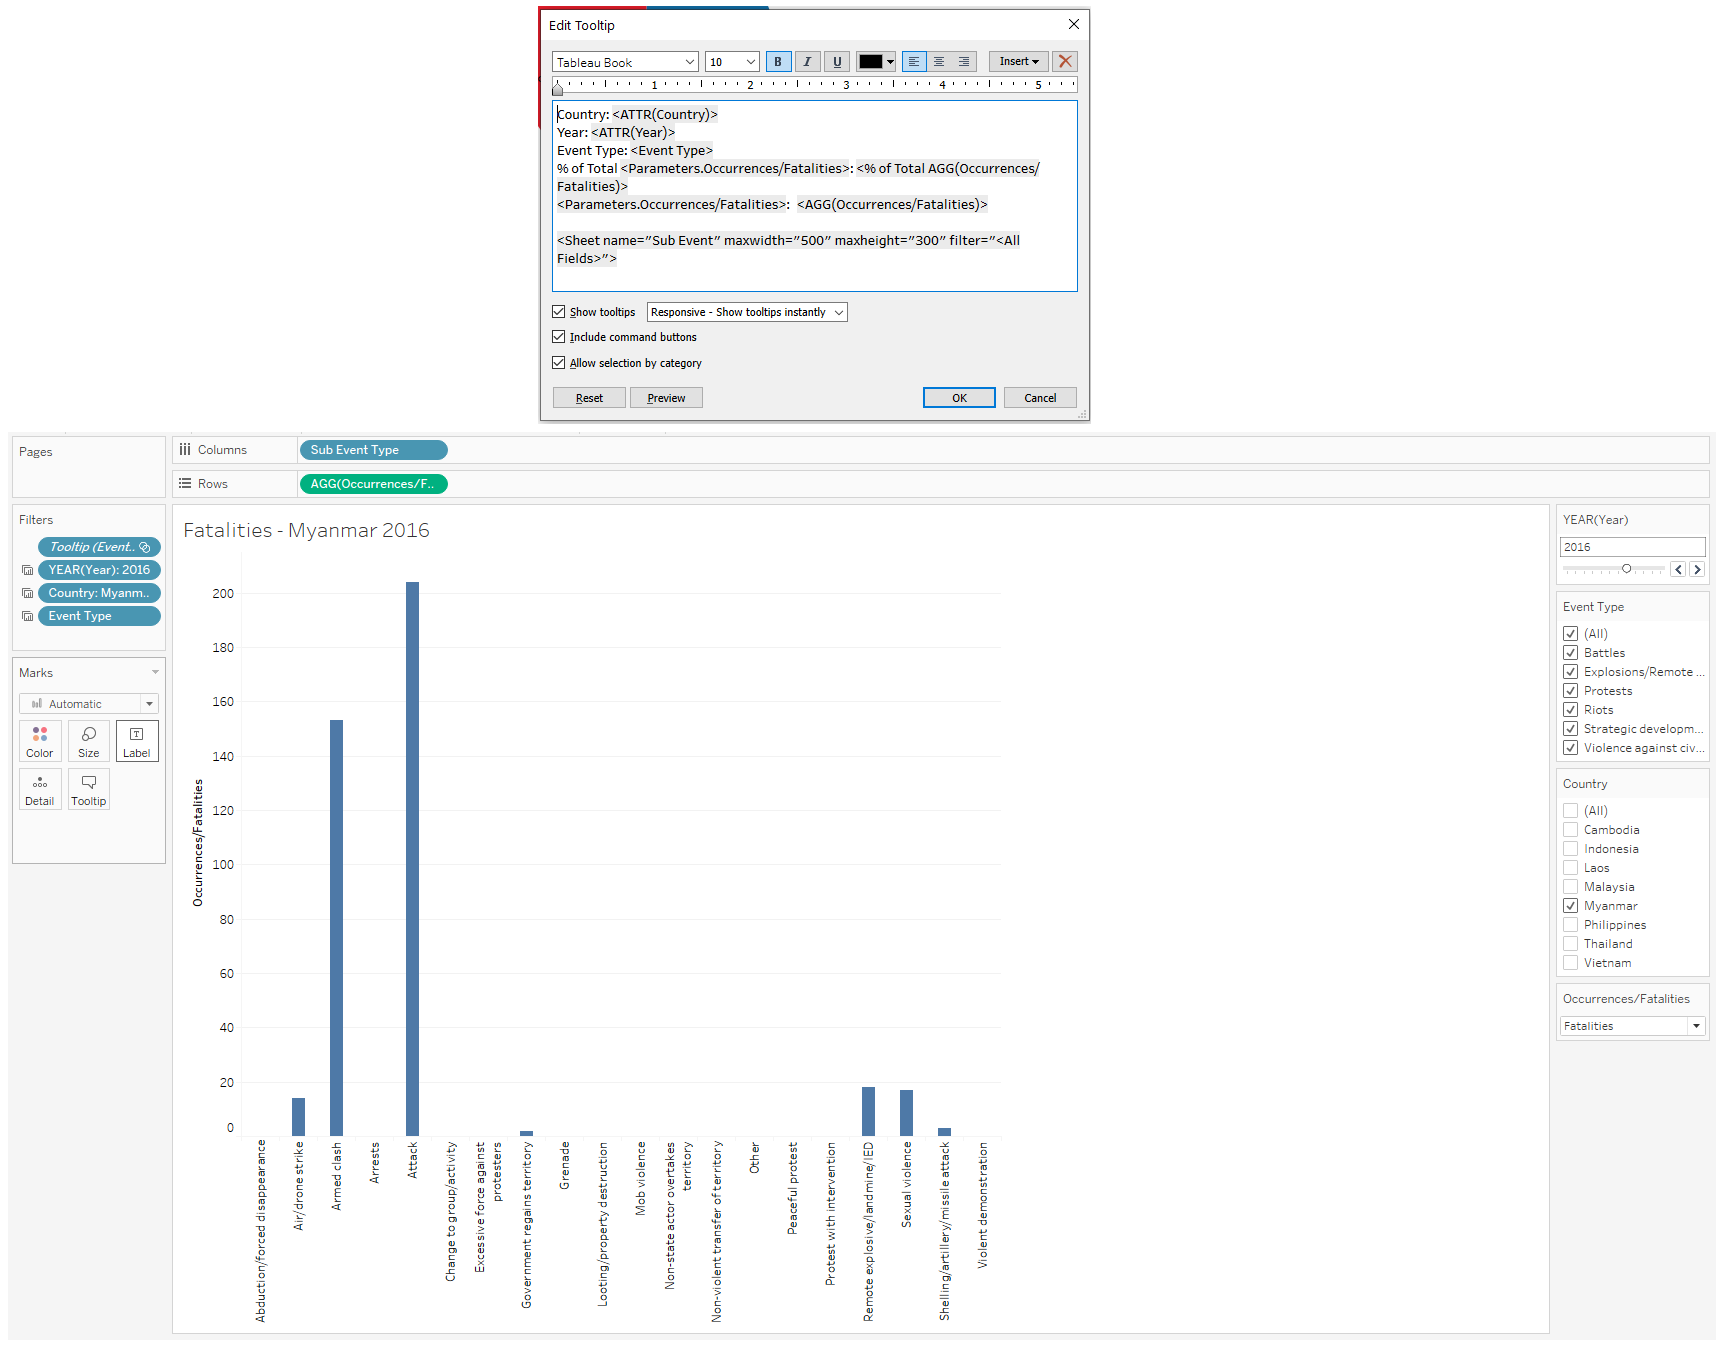
Figure 15: Pie Chart - Tooltip
- Add Sub Event to Columns
- Add Occurrances/Fatalities to Rows
- Add Year, Country and Event Type to Filters
- Rename Sheet as “Sub Event”
- Return to Sheet “Pie Chart” and add Tooltips according to the formula in the Figure
Compiling the Dashboard
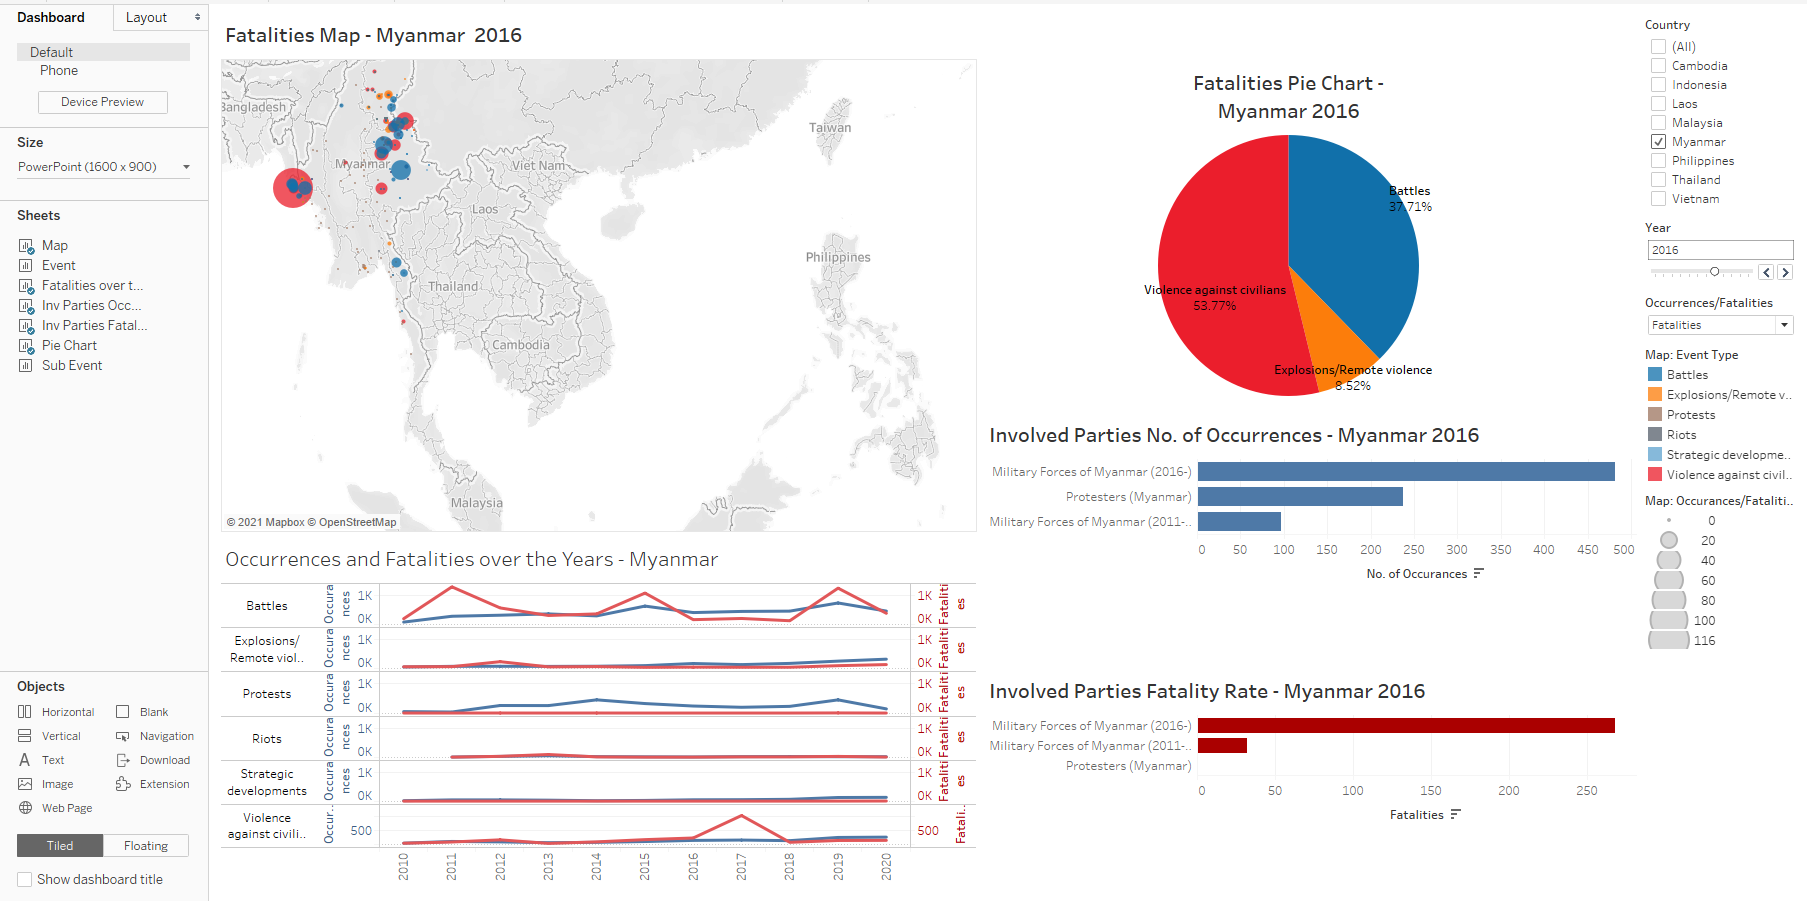
Figure 16: Compiling the Dashboard
- Compile the different sheets into the dashboard as above
- Ensure that the Country Filter are linked to all the sheets, through “Apply to Worksheets”
- Ensure that the Year is linked too all sheets except “Fatalities over the Years”
- Ensure that Parameter Occurrences/Fatalities is linekd to all sheets.
The Visualisation is finally done, and final product can be viewed through Tableau Public https://public.tableau.com/profile/louelle.teo#!/vizhome/DatavizMakeover3/Dashboard1?publish=yes
Five Major Observations from the Visualisation
1. Increase in peaceful Protests since 2010
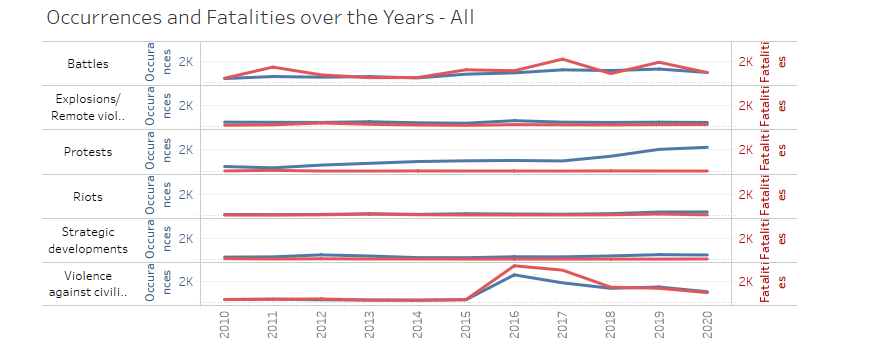
Figure 17: Protests Increases
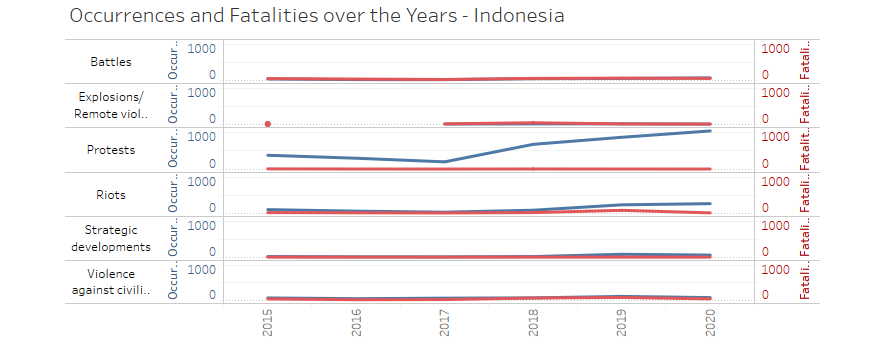
Figure 18: Protests Increases in Indonesia
Since 2010, the number of protest occurrences have risen over time across ASEAN. This is especially true for Indonesia and Thailand. However, the number of fatalities have generally remained low relative to the rise in protests.
Indonesia had a fair share of peaceful protest, with major themes around corruption, labour laws, jobs, and their economic outlook.
2. Myanmar, Philippines, Thailand have had the highest fatality rates in the last decade.
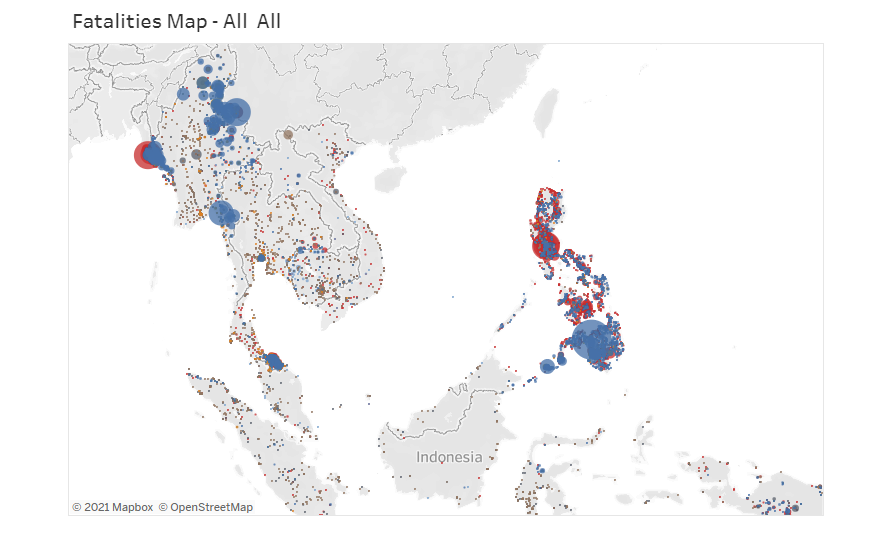
Figure 19: Fatality Map
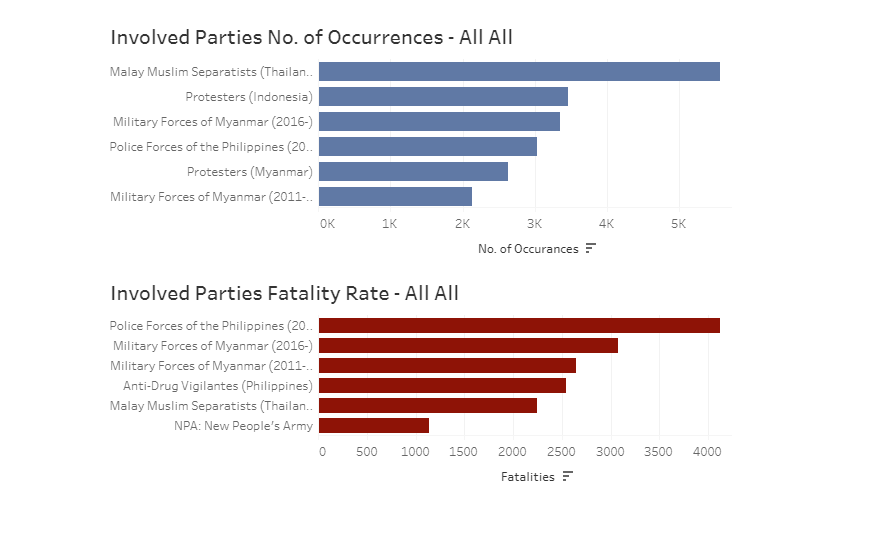
Figure 20: Involved Parties
Across ASEAN, the number of occurrences and fatalities from violence against civilians are concentrated in three key clusters.
First, in Myanmar, and especially in the Rakhine and Shan regions. This is due to major ethnic conflicts that spans 7 decades, leading to sporadic violence between government forces and the insurgent groups.
Second, in the Philippines, and involving the Police Forces of the Philippines and Anti-Drug Vigilantes. The war on drugs started around 2016, and has by far the biggest fatality in ASEAN for the last decade. President Rodrigo Duterte had made a strong stance against drug criminals and drug addicts, allowing members of the public, and also police to kill known criminals and addicts without repurrcussions. This has lead to an outcry by many human rights groups, and also citizens, who could have been a victim to wrong accusations. The consequences of such a policy is still developing, and we can hope that no lasting long term detrimental effects are caused due to this strong stance.
Lastly, in the Southern Thai provinces of Yala, Narathiwat, and Pattani, involving the Malay Muslim Separatists in Thailand. These conflicts arose from early 1930s, where the concept of being a Thai, and also having Buddhist practices, conflicted with the Muslim Thais who observed Islamic Law.
3. Increase in the number of Battles and Violence against Civilians
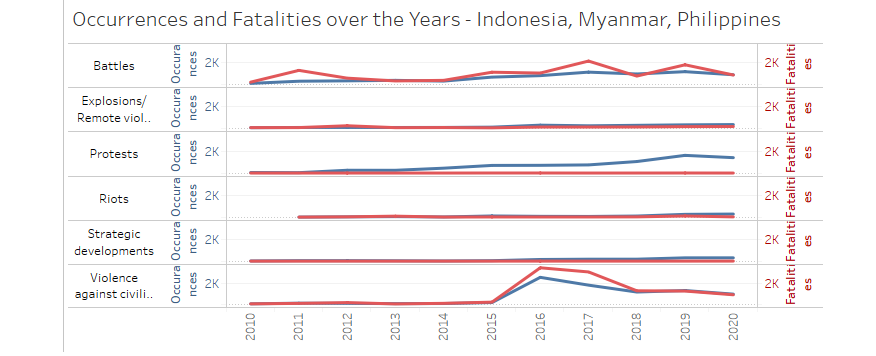
Figure 21: Increase in Battles and Violence
The number of battles have also risen over time. These battles generally occur in the same regions where we see violence against civilians, namely the Northern Myanmar provinces of Shan and Kachin, Mindanao in Southern Philippines, Southern Thailand provinces of Yala, Narathiwat and Pattani, and also Papua in Indonesia.
The increase in military and police force against civilians are increasing, and it will continue to be a difficult battle in the years to come.
4. Myanmar continues to be in a difficult position
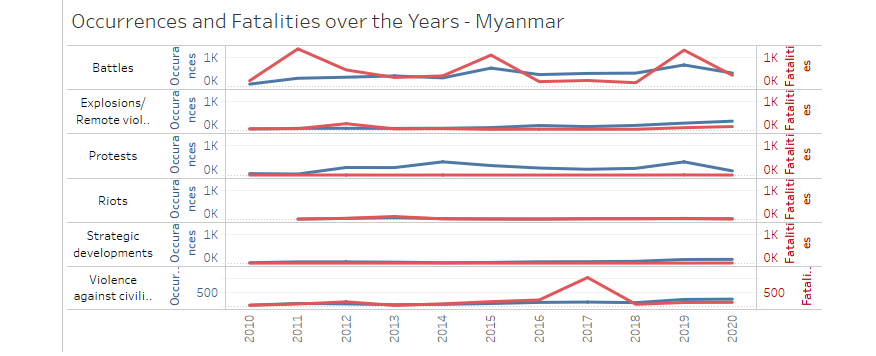
Figure 22: Myanmar continues to be in a difficult position
Myanmar is the only country in ASEAN where the fatality rate (fatalities / number of occurrences) has risen over time. This is excluding Laos where the sample size of occurrences is quite limited.
Even as the news continue to escalate today, the greatest casualty and victims continue to be the citizens. Covid-19 has wrecked their economy, and unrest continues to deprive villages of essentials such as basic food and water.
5. Fake news is dangerous in spreading unrest
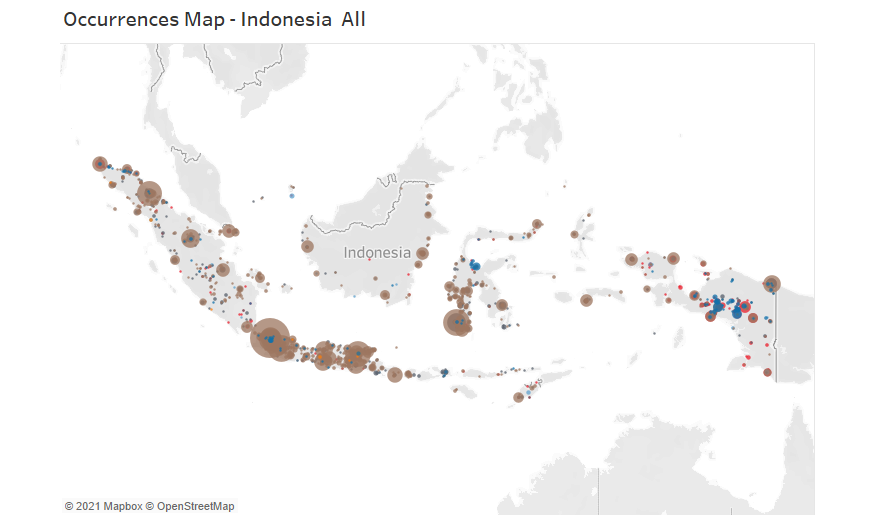
Figure 23: Indonesia Protests mainly in the City
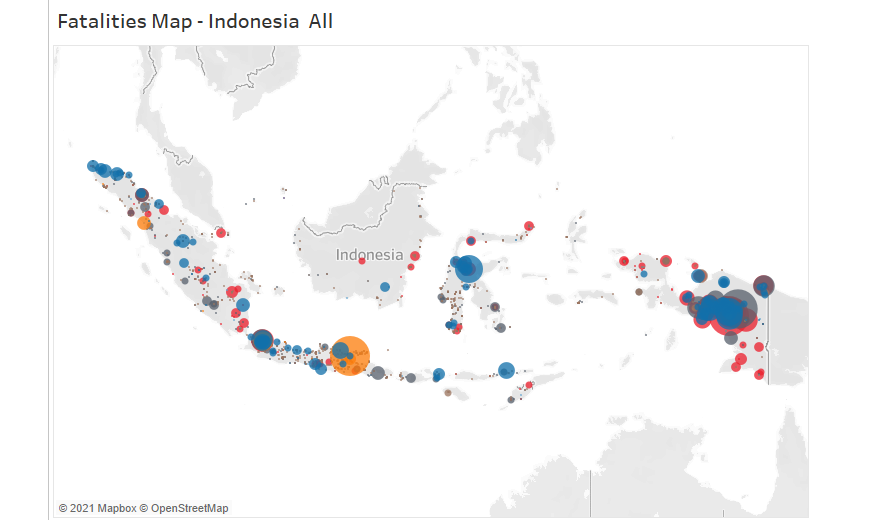
Figure 24: Indonesia fatalities mainly in the Papua
In Indonesia, the fatalities are disproportionately concentrated in Papua and to a smaller extent, East Java. Meanwhile, the bulk of the protests occur in the metropolitan areas such as Jakarta
Most of the fatalities in Papua happened in a small number of occurrence, with the cause of the riots still vaguely unknown, it goes to show how fake news and violence can spread like wildfire.